|
Chainlink (LINK)
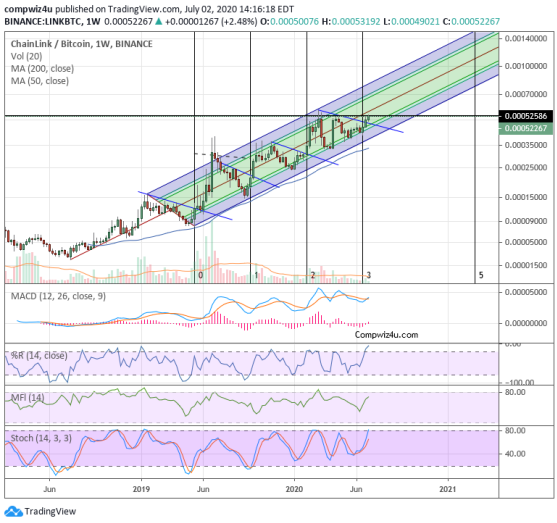
I am very proud of this
LINK/BTC chart from
7/2/2020
as I nailed the move to the top of the pitchfork.
This is the comment I sent to my subscribers:
"LINK/BTC is getting ready to break over horizontal resistance &
then move to new highs on its weekly log chart.
Its indicators are all bullish & it is now in the Fibonacci Time Zone #3. The
two previous zones have led to price spikes.
When it's time, it’s time."
Again on 6/20/2023, it's
time as the bottom is in.
Sign up to my
crypto newsletter
to follow along
on this new leg of its bull market.
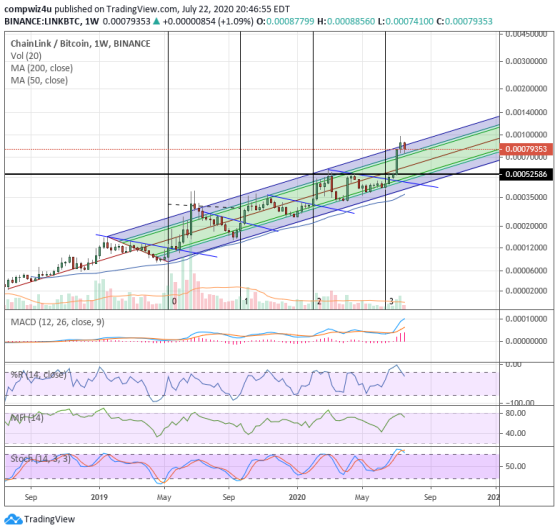
This is the LINK/BTC chart as of 7/22/2020.
It shows the price went to the top of the pitchfork &
found resistance there, as expected.
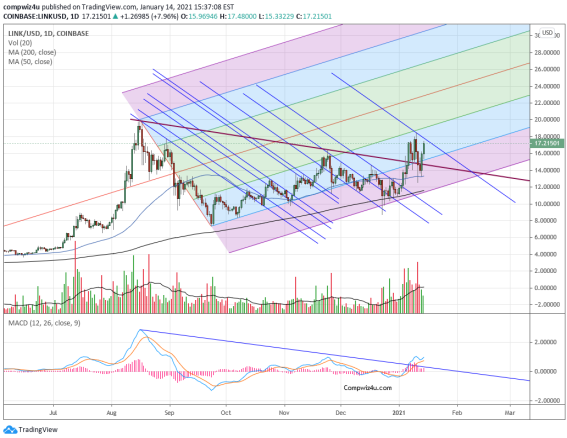
This is LINK/USD on 1/14/21,
showing a big breakout over the black resistance line
& the next blue line resistance.
The parallel blue lines
are tied to price points
and show the progress up the pitchfork.
Upon trend changes those
lines show
the likely price direction down.
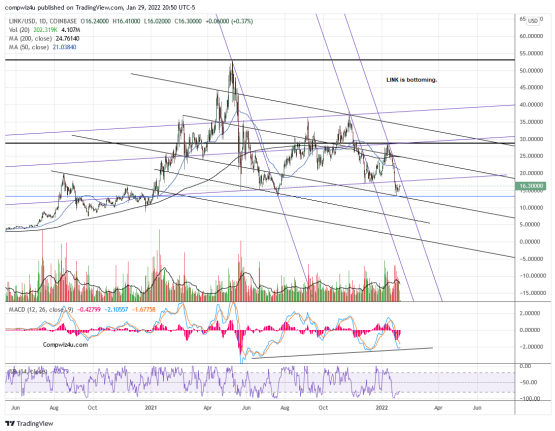
1/29/22
A year later, this chart shows the LINK/USD
price
had topped on May 21.
Now it appears that the recent
correction has ended.
MACD is turning
bullish as it is curling up along an uptrend.
One thing about LINK is that my pitchforks show
its direction
as well as
its buy and sell points with a high degree of accuracy.
As of 7/20/23, this technique still amazes
me
as it is pointing to another big bull move like 2021.
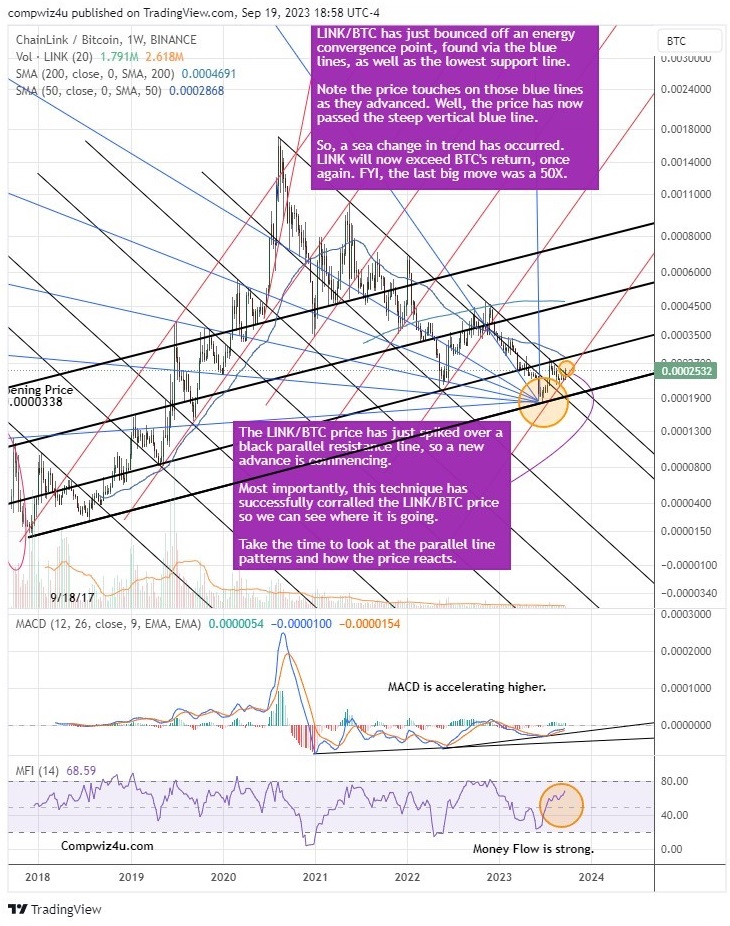
This is my latest weekly chart of LINK/BTC on 6/19/23
which shows Link is starting to outperform BTC.
This is a closeup of the daily action on 6/19/23
with the blue lines now in a
bullish direction.

|